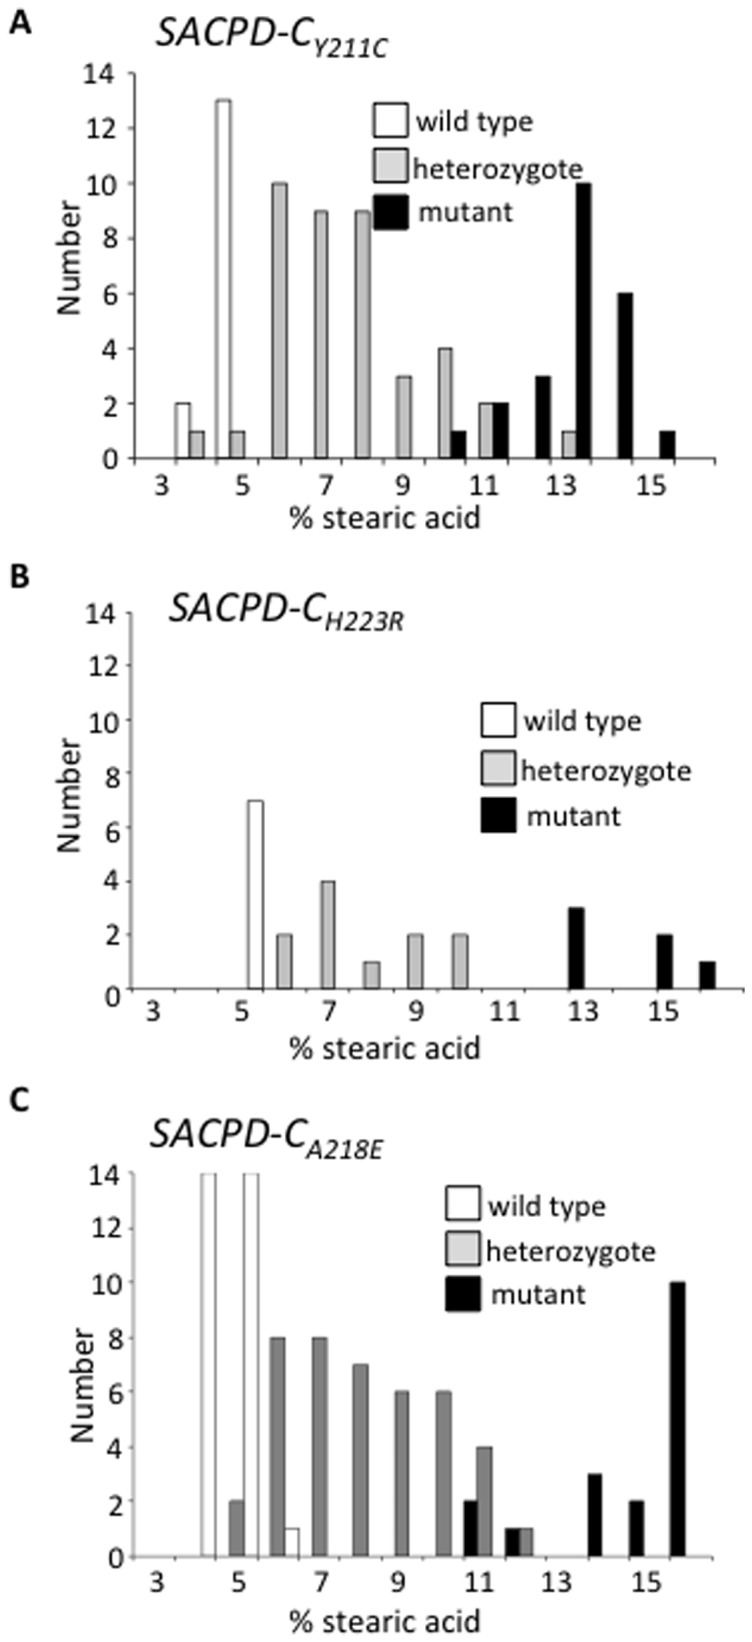
Figure 2. Cosegregation of SACPD-C mutations and elevated stearic acid phenotype.

Individuals from segregating populations were analyzed for stearic acid content and genotyped for A. SACPD-CY211C (78 indivduals) B. SACPD-CH223R (24 individuals), and C. SACPD-CA218E (89 individuals). White bars indicate wild-type individuals, grey bars indicate heterozygous individuals, and black bars indicate homozygous mutants.
