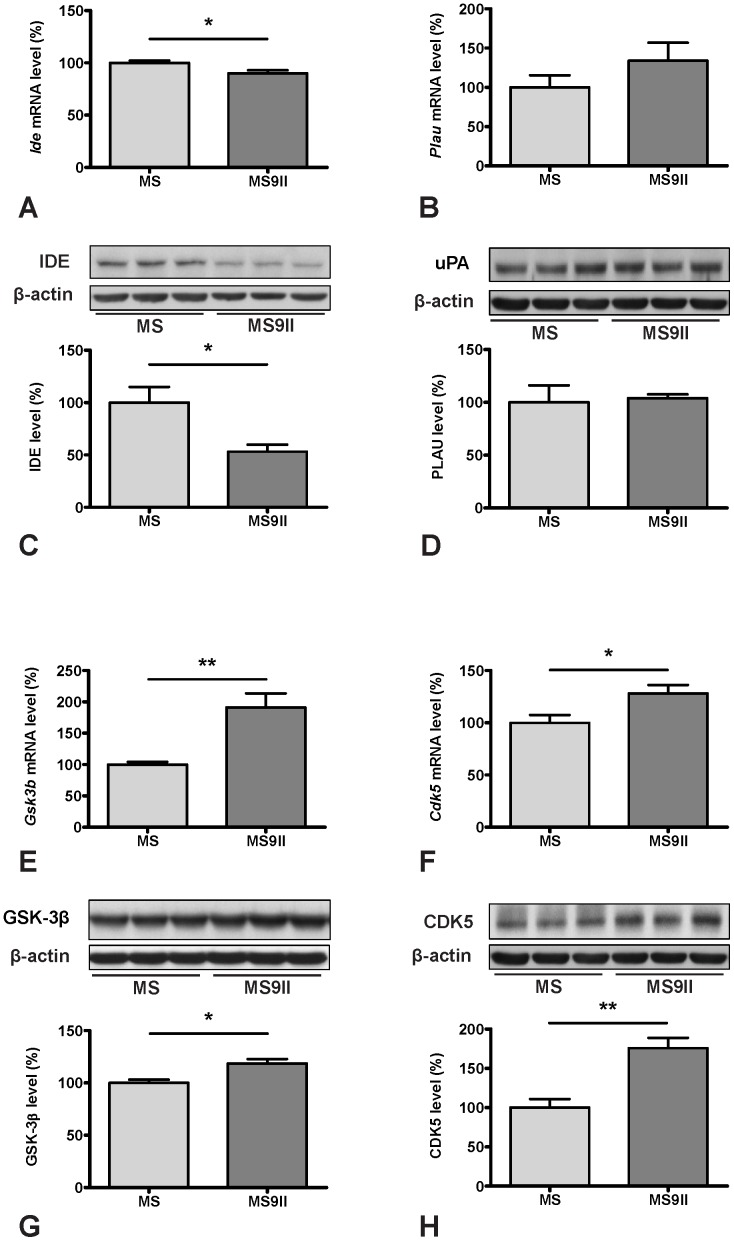
Figure 4. Transcript and protein expression levels of IDE (A, C), PLAU (B, D), GSK-3β (E, G) and CDK5 (F, H) in MS and MS9II cells.
Histograms showing decreased levels of Ide mRNA (A) and unaltered levels of Plau mRNA (B) in MS9II cells compared to MS cells. Immunoblots and respective histograms validating decreased IDE (C) and unchanged uPA (D) levels in MS9II cells. Histograms showing increased mRNA levels for Gsk3b (E) and Cdk5 (F) in MS9II cells compared to MS cells. Immunoblots and respective histograms showing marked increase in protein levels of GSK-3β (G) and CDK5 (H) in MS9II cells. The protein levels were normalized to the β-actin and the values from four different experiments are expressed as means ± SEM, *p<0.05, **p<0.01.

