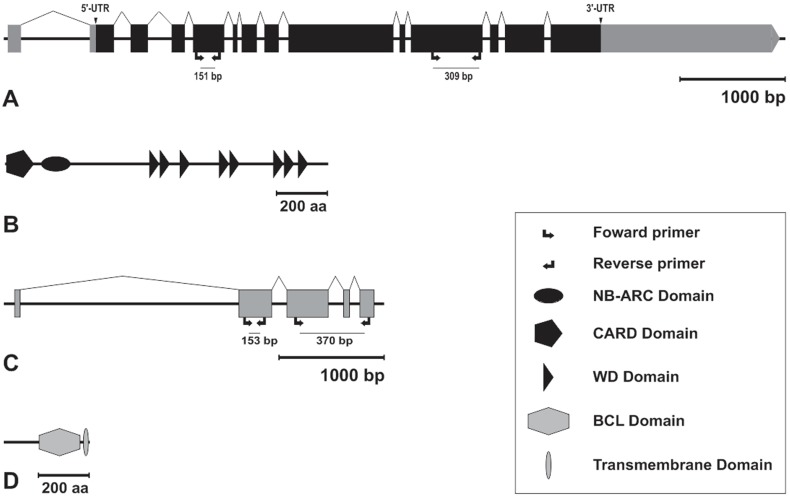
Figure 1. Gene and protein architectures.
Schematic representations of Amark (A) and Ambuffy (C) gene sequences and their respective predicted proteins, Amark (B) and Ambuffy (D). Exons were manually annotated to the corresponding genomic scaffold using Artemis 7.0 tools or automatically annotated in BeeBase website (http://www.hymenopteragenome.org/beebase/?q=home). The 5′-UTR and 3′-UTR (gray) regions are indicated for the Amark gene. Protein domains were predicted using bioinformatics tools from SMART and the NCBI conserved domain database. Scale (bars on the right) indicate size of the genomic sequences (bp: base pairs) and protein sequences (aa: amino acids). Arrows show the position of the primers used for Amark and Ambuffy transcript quantification by qPCR (left) and localization by FISH (right).

