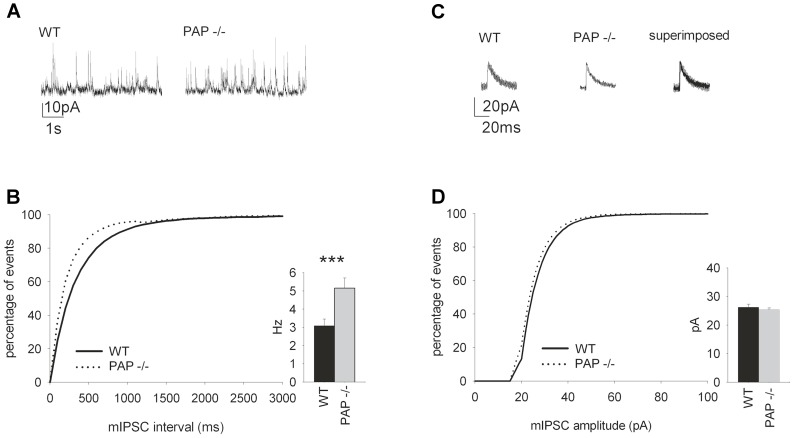
Figure 7. The frequency of spontaneous hippocampal mIPSCs is increased in PAP−/− mice.
(A) Sample traces of mIPSC from WT and PAP−/− mice (P14–P18). (B) The mIPSC frequency in the PAP−/− mice was higher (p = 0.003) compared to WT mice. The graph shows the cumulative distribution of the events. (C) Sample traces from 8 averaged mIPSCs from PAP−/− and WT mice. (D) There were no differences in the amplitude in mIPSCs recorded from WT and PAP−/− mice. The graph shows the cumulative distribution of the amplitudes.

