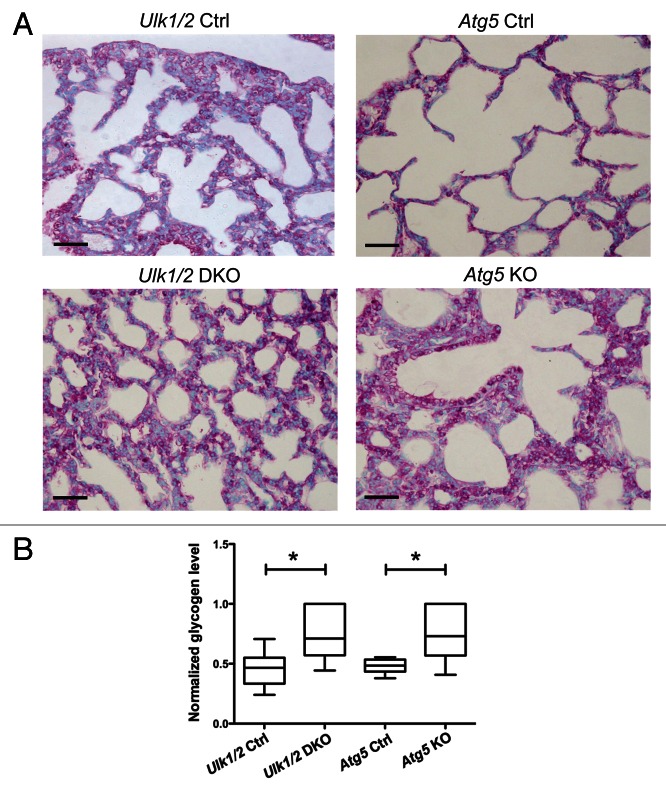
Figure 3. PAS staining of lungs from Ulk1/2 DKO and Atg5 KO mice at P1 show persistence of glycogen-filled cells. (A) Lungs from Ulk1/2 Ctrl; Ulk1/2 DKO; Atg5 Ctrl and Atg5 KO mice at P1 were fixed, embedded in paraffin, sectioned, and subjected to PAS staining. Scale bar: 10 μm. (B) Increased glycogen levels in lungs from Ulk1/2 DKO and Atg5 KO mice at P1. Lungs from Ulk1/2 Ctrl; Ulk1/2 DKO; Atg5 Ctrl and Atg5 KO mice at P1 were homogenized and glycogen content was measured as described in Materials and Methods. The box and whisker plot shows glycogen levels as ng glycogen/μg protein, with the whiskers set to the minimum and maximum values in each group and the box displaying the 25th and 75th percentiles around the median. Data were normalized within each genetic background (Ulk1/2 Ctrl with DKO, and Atg5 Ctrl with KO), with n = 6 for Ulk1/2 Ctrl, n = 6 for Ulk1/2 DKO, n = 7 for Atg5 Ctrl and n = 5 for Atg5 KO. * indicates P value < 0.05 determined by ANOVA with Bonferonni’s Multiple Comparison test.

An official website of the United States government
Here's how you know
Official websites use .gov
A
.gov website belongs to an official
government organization in the United States.
Secure .gov websites use HTTPS
A lock (
) or https:// means you've safely
connected to the .gov website. Share sensitive
information only on official, secure websites.
