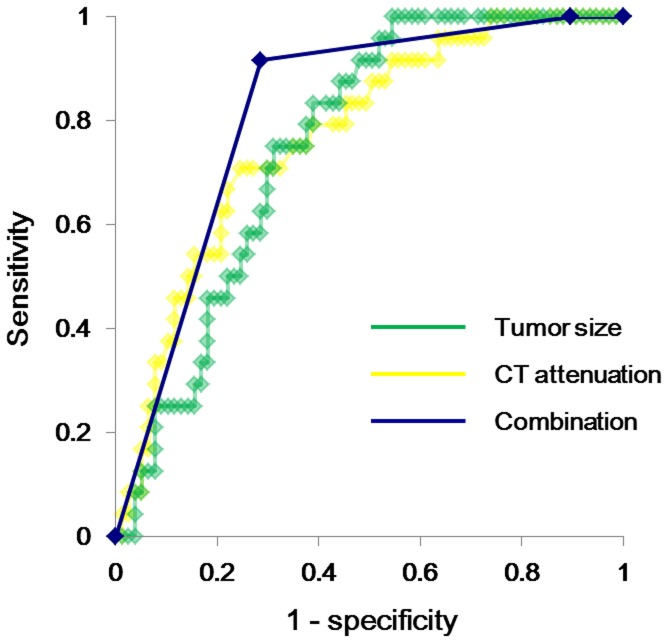
Figure 2. Receiver operating characteristic curve analysis for invasive adenocarcinoma prediction: tumor size and computed tomography attenuation.
The sensitivity and specificity of tumor size for predicting invasive adenocarcinoma were 95.8% and 46.8%, respectively, at a cutoff value of 11.0 mm, with an area under the curve (AUC) of 0.75 (green curve). The sensitivity and specificity of the mean computed tomography (CT) attenuation were 95.8% and 35.1%, respectively, at a cutoff value of –680 HU, with an AUC of 0.77 (yellow curve). The sensitivity and specificity of the combined variable (tumor size and mean CT attenuation) were 91.7% and 71.4%, respectively, at cutoff values of 11 mm and −680 HU, with an AUC of 0.82 (blue curve).

