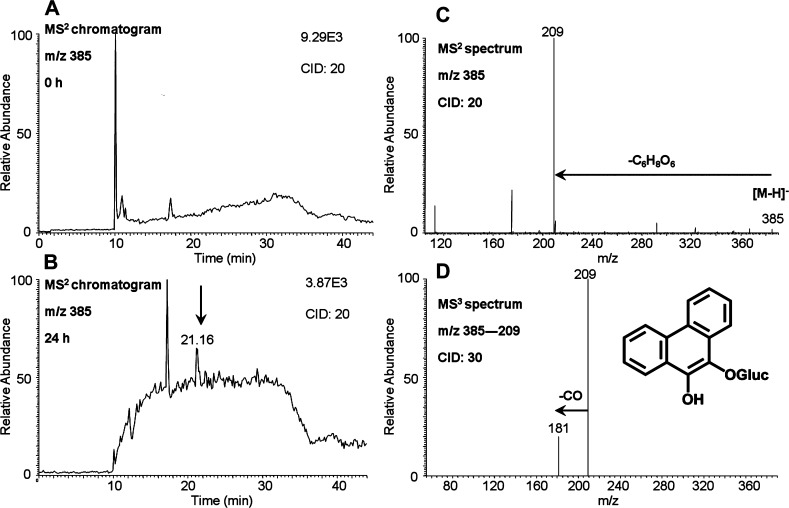
Figure 2.
O-Mono-glucuronosyl-phenanthrene-9,10-catechol detected in HepG2 cells. (A) MS2 chromatogram at 0 h. (B) MS2 chromatogram at 24 h. (C) MS2 spectrum. (D) MS3 spectrum. HepG2 cells (∼5 × 10⁶) were treated with phenanthrene-9,10-quinone (1 μM, 0.2% (v/v) DMSO) in MEM (without phenol red) containing 10 mM glucose. The cell media were collected at 0 and 24 h and were subsequently acidified with 0.1% formic acid before extraction with ethyl acetate. The extracts were analyzed on an ion trap LC–MS/MS.

