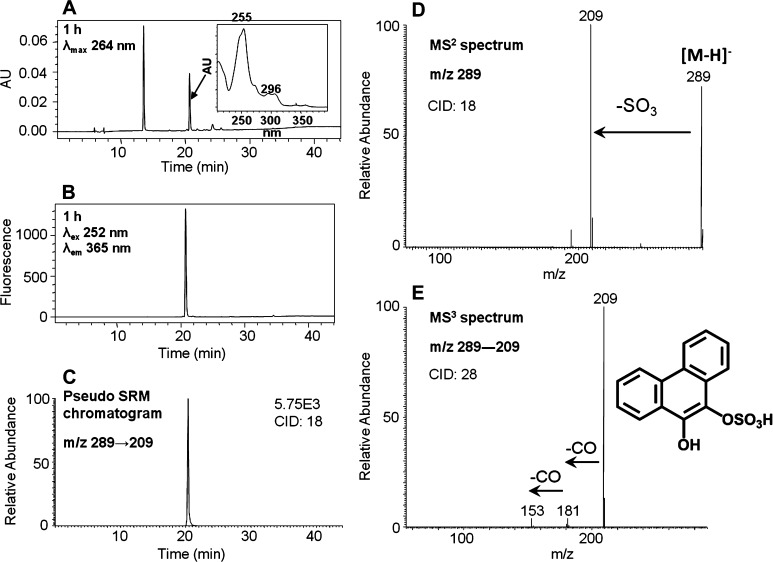
Figure 6.
Characterization of synthetic O-mono-sulfonated-phenanthrene-9,10-catechol. (A) UV chromatogram at λmax 264 nm. (B) FLR chromatogram at λex 252 nm and λem 365 nm. (C) Extracted ion chromatogram of the pseudo-SRM transition. (D) MS2 spectrum. (E) MS3 spectrum. The product profiles were obtained after 1 h incubation of phenanthrene-9,10-catechol with SULT1A1 and PAPS.

