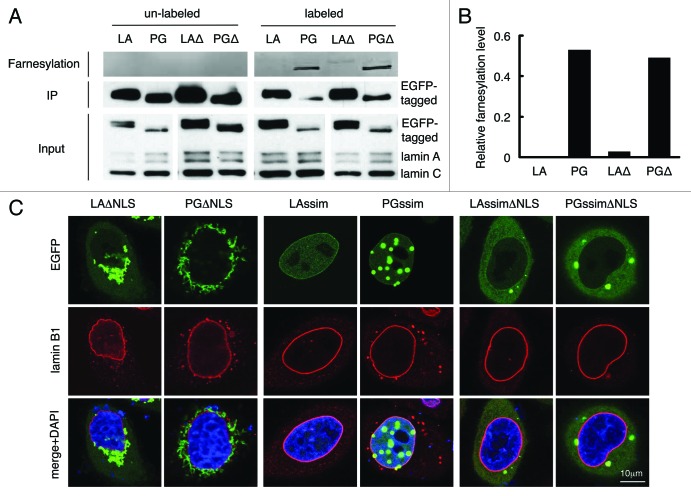
Figure 2. C-terminal farnesyl group tethers LAΔNLS and PGΔNLS to the ER membrane. (A) Click chemistry analysis. HeLa cells were transfected with EGFP-LA, EGFP-PG, EGFP-LAΔNLS or EGFP-PGΔNLS and labeled with Click-iT farnesyl alcohol, followed by precipitation with GFP-Trap beads and detection with 647 Alkyne. Strong farnesylation signals appeared in PG and PGΔNLS (PGΔ) lanes, and weak but detectable farnsylation showed in LAΔNLS (LAΔ) lane. (B) Quantification of farnesylation levels in (A). The relative farnesylation level was calculated as the ratio of the farnesylation signal to the corresponding IP’ed protein signal. (C) Confocal fluorescence images of LAssimΔNLS and PGssimΔNLS. Immunofluorescence was performed 24 h after transfection. Confocal images show EGFP (green), lamin B1 (red), and DNA (blue). A representative cell under each condition is shown. Scale bar, 10 μm.

An official website of the United States government
Here's how you know
Official websites use .gov
A
.gov website belongs to an official
government organization in the United States.
Secure .gov websites use HTTPS
A lock (
) or https:// means you've safely
connected to the .gov website. Share sensitive
information only on official, secure websites.
