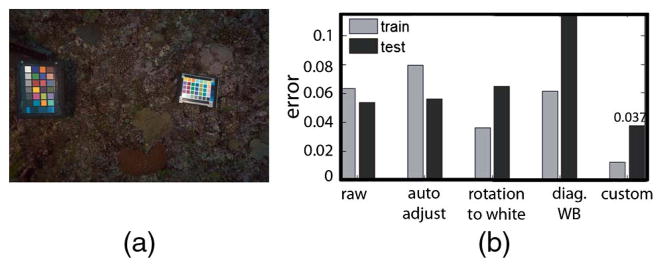
Fig. 16.

Example V: Consistent underwater color correction. (a) In each frame, the color chart on the left was used for calibration, and the one on the right was for testing. Images were taken in Toyota Reef, Fiji. (b) Average error for several color-corrected methods for training and testing. Our method achieves the lowest error and is the only method to improve over the raw images of the test chart.
