
Fig. 2.
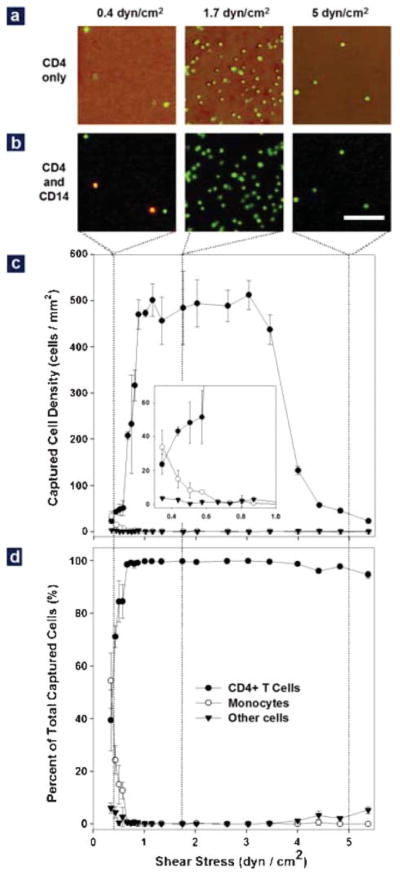
Effect of shear stress on cell adhesion in the Hele–Shaw devices using whole blood from healthy subjects. (a) Representative images of cells captured in the Hele–Shaw chamber at locations corresponding to shear stresses of 0.4 (left), 1.7 (middle) and 5 dyn cm−2 (right). The image was created by overlapping a phase contrast photograph and the corresponding fluorescence photograph. All the cells in the phase contrast image are stained positively (green) for the CD4 surface marker, but captured cell density is greatly dependent on the shear stress. (b) Representative images of captured cells after CD4 (green) and CD14 (red) staining at the shear stresses conditions as described in (a). Both lymphocytes (CD4+CD14−, green) and monocytes (CD4+CD14+, yellow) were captured at the shear stress of 0.5 dyn cm−2, but pure lymphocytes were captured at two higher shear stresses. (Bar: 100 μm) (c) Adhesion of CD4+ T cells (solid circles), monocytes (empty circles) and other cells (solid triangles) in response to shear stress. Differentiated capture of monocytes and lymphocytes in response to shear was observed: a shear stress window between 1 and 3 dyn cm−2 was optimal for CD4+ T cell adhesion, while monocyte adhesion drops significantly above 0.7 dyn cm−2 (inset). The adhesion of other cells is minimal in the whole range of tested shear stress. (d) Composition of the surface captured cells as a function of shear stress. When shear stress is above 0.7 dyn cm−2, >95% of the surface captured cells are CD4+ T cells (solid circles). The purity of these cells drops quickly to less than 50% when shear stress drops below 0.7 dyn cm−2. In (c) and (d), each data point was repeated in 3 devices spanning different shear stress ranges; error bars represent standard deviations in measurements within each experiment.