Figure 2.
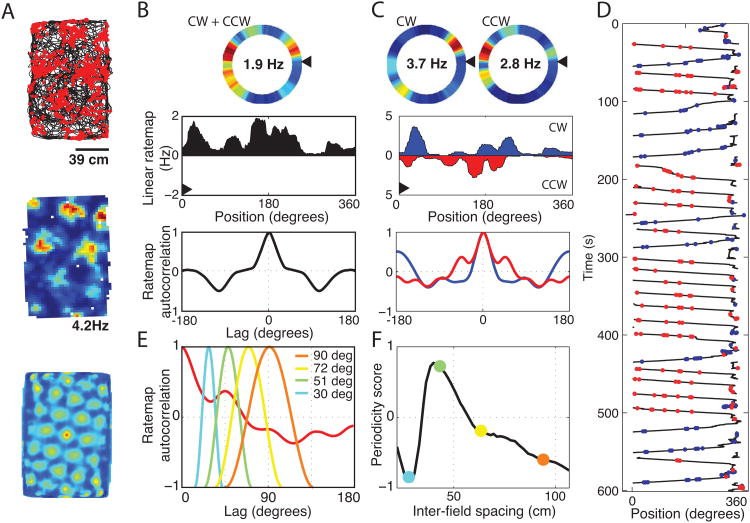
Grid cell tuning on a circle track. A. Cells were identified as grid cells during the pre-injection baseline open field screening trial as cells with multiple regularly spaced firing fields that resulted in a grid score that was larger than 95% of 200 randomly permuted rate maps. The firing of a representative grid cell is shown as red dots plotted over a black line tracing the trajectory of an animal in one such screening trial (top). The rate map and 2D autocorrelogram are also shown, illustrating the standard tessellating grid structure of the spatial tuning (middle and bottom). B. The tuning of the same grid cell is shown on the circle track both as a heat-map (top). The same data is plotted as a line graph (middle) such that the leftmost edge of the line graph starts at the black arrowhead in the top graph and wraps around the circle in a counter-clockwise direction. Multiple distinct fields of high firing rate can be seen separated by fields of low firing rates. The 1D spatial autocorrelogram is shown (bottom). C. The tuning becomes more clear in this example when running is split into clockwise (CW) and counter clockwise (CCW) laps. All subsequent analyses were computed separately on CW and CCW laps and then linearly combined based on the percentage of time spent running in each direction. D. Spiking raster for the same cell. Spikes from CW laps are shown in red, spikes from CCW laps are in blue. E. The spatial periodicity of the firing rate was calculated by computing the correlation between the 1D autocorrelogram and a family of partial cosine waves of differing spatial frequencies. F. The highest correlation obtained over the set of cosine waves (as shown in E) was taken as the spatial periodicity score. The colored dots reflect the periodicity scores resulting from the analysis of the sample waveforms shown in E.

