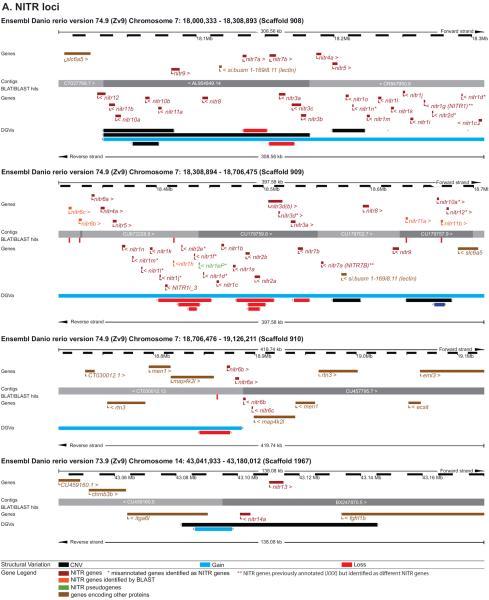
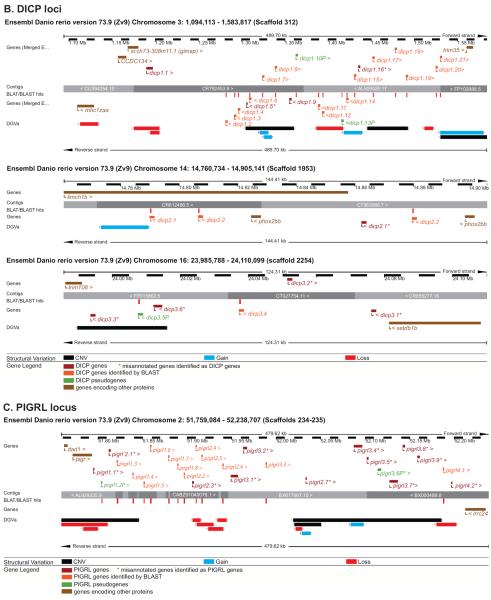
Figure 5. Evidence for haplotypic variation at the NITR, DICP and PIGRL loci.
The regions of (A) chromosomes 7 and 14 that encode the NITR genes, (B) chromosome 3, 14 and 16 that encode the DICP genes and (C) chromosome 2 that encodes the PIGRL genes are shown in detail. Graphics were adapted from the Ensembl Genome Browser, www.ensembl.org/Danio_rerio/. The NITR, DICP and PIGRL genes (red and orange) and relevant flanking genes (brown) are annotated above and below the genomic contigs. The Database of Genomic Variants archive (DGVa) provides the genomic structural variants: regions of copy number variation (CNV) are indicated in black, regions of gene loss are indicated in red, and regions of gene gain are indicated in blue.


