
Figure 1. Intraclass correlation and minimal detectable change.
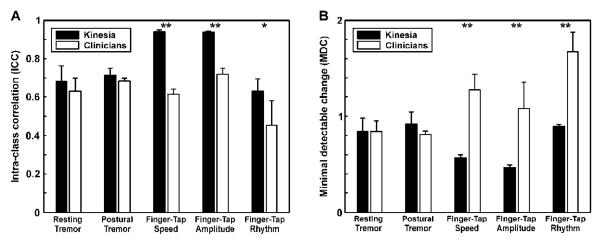
The average ICCs (A) and MDCs (B) are plotted for the Kinesia and clinician scores. The metrics were calculated separately for each clinician and averaged together. Error bars correspond to the standard deviation across each combination of repetitions. *p<0.05, **p<0.0001. ICC: intraclass correlation; MDC: minimal detectable change.