
FIGURE 2.
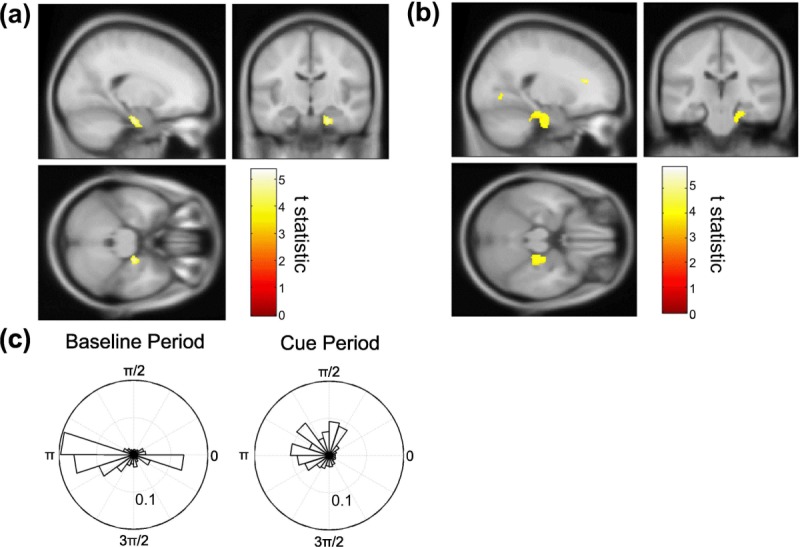
mPFC-aMTL theta coupling during retrieval. Group-averaged brain images showing a significant increase in theta phase coupling between the mPFC seed and right aMTL between baseline and cue periods, identified using the (a) phase locking value (PLV, peak at [20; −16; −26], Z-score = 4.52) and (b) phase lag index (PLI, peak at [22; −24; −22], Z-score = 3.48). Both images shown at the statistical threshold of P < 0.001 uncorrected overlaid on the canonical Montreal Neurological Institute 152 T1 image. (c) Circular histogram of theta phase differences between mPFC seed and aMTL voxel exhibiting the group peak PLV increase for a single subject at each time point during a typical baseline and cue period (in this case the PLI values were: baseline PLV = 0.29, cue PLV = 0.36). Note the narrower distribution of phase differences during the cue period. [Color figure can be viewed in the online issue, which is available at http://wileyonlinelibrary.com.]