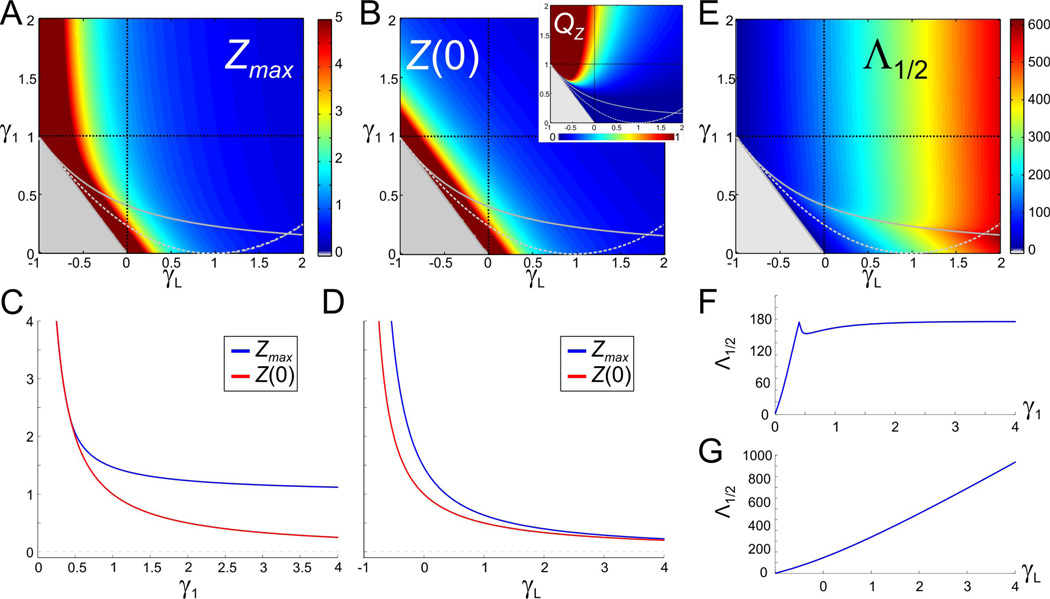
Figure 3.
The attributes of resonance for the 2D linear system (6) (as in Fig. 2). A. The maximum impedance Zmax. B. The zero-frequency input resistance Z(0) (same scale as A). Dark red regions in A and B are outside the scale of the graph. Gray region and curves as in Fig. 2A2. Inset shows QZ (the difference between Zmax and Z(0)) in the same range of γ1 and γL. C. Representative example of Zmax and Z(0) as a function of γ1 for γL = 0 (vertical dashed black line in A and B). D. Representative example of Zmax and Z(0) as a function of γL for γ1 = 1 (horizontal dashed black line in A and B). E. Half band-width Λ1/2. F. Representative example of Λ1/2 as a function of γ1 for γL = 0 (vertical dashed black line in E). G. Representative example of Λ1/2 as a function of γL for γ1 = 1(horizontal dashed black line in E).

