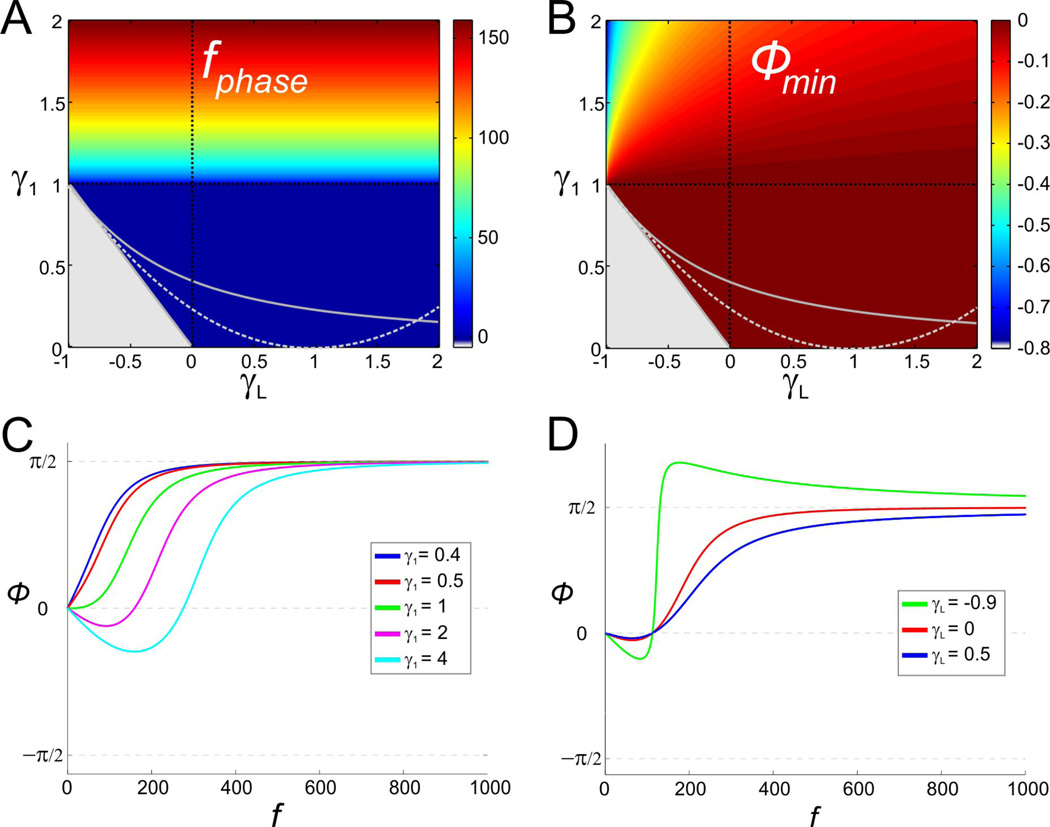
Figure 5.
Negative-phase-frequency-band for the 2D linear system (6) (as in Fig. 2). A. The length of the negative-phase-frequency band (or, equivalently, the zero-phase-frequency fphase). B. Minimum phase (ϕmin) of the voltage response. Gray region and curves as in Fig. 2A2. C. Representative example of the phase profile as a function of γ1 for γL = 0 (vertical dashed black line in A and B). D. Representative example of the phase profile as a function of γL for γ1 = 1 (vertical dashed black line in A and B).

