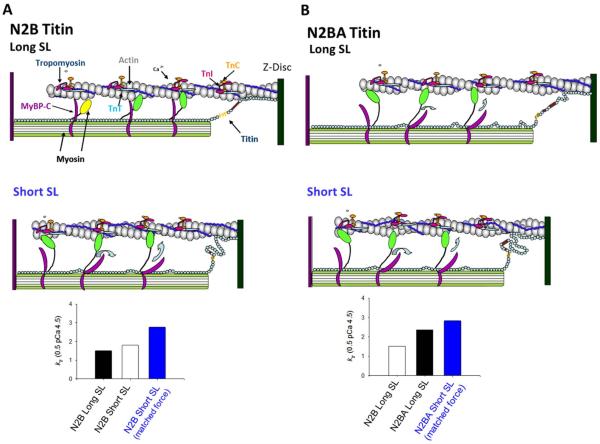
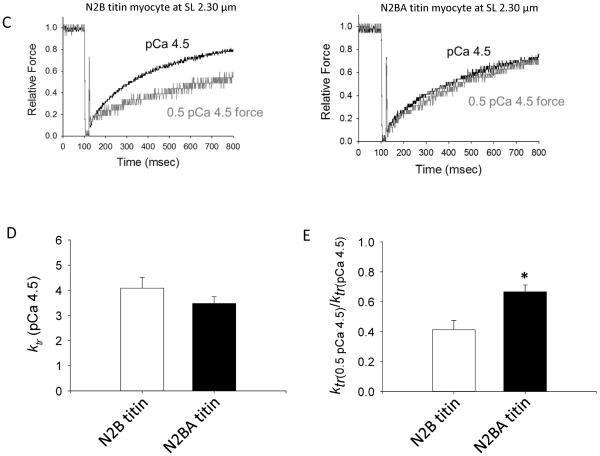
Figure 4.
A & B. Theoretical model of thin filament compliance (e.g., tropomyosin persistence length) with sarcomere length and longer titin isoforms. Faster force development at short SL (bar plots in A) may arise from greater thin filament compliance and less cooperative recruitment of force-generating cross-bridges. According to this idea force development rates (indexed by ktr) should be greater in myocytes with longer more-compliant N2BA titin (theoretical bar plots in panels A & B). C–E. While ktr during maximal Ca2+ activation was not different between N2B and N2BA myocytes at sarcomere length 2.30 μm (C & D), ktr was faster in N2BA myocytes during submaximal Ca2+ activations (C & E). This difference is more evident when assessed by the ktr ratio between half-maximal Ca2+ activated force (0.5 pCa 4.5) and maximal Ca2+ activation (pCa 4.5) (E). Bar plots are means ± SEM; *p<0.05, n = 7 for each group.


