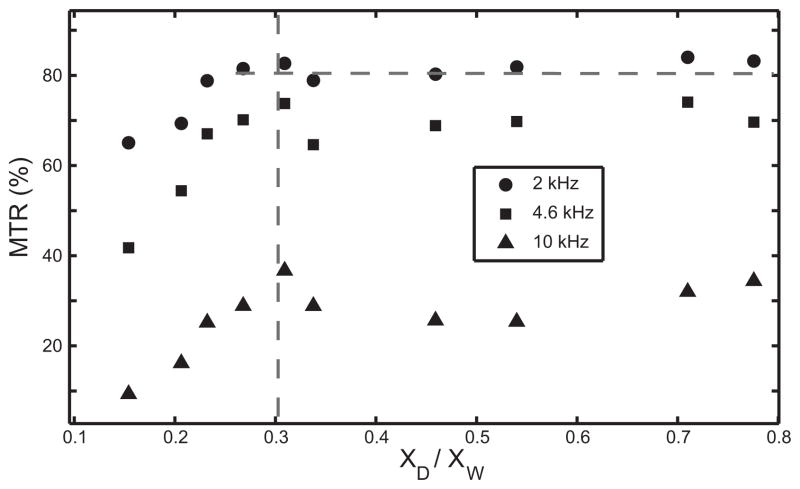
Figure 6.
Percent MTR at 5 μT RF MT-pulse for three frequency offsets (see legend for symbol assignment) as a function of the molar ratio of decanol-to-water protons (directly proportional to in Fig. 4). The vertical dashed line indicates the range of semisolid fractions (participating in MT) that can be quantitatively inferred from direct MTR measurements. The horizontal dashed line illustrates the lack of detectible variation in MTR for decanol-to-water fractions above 0.3.

