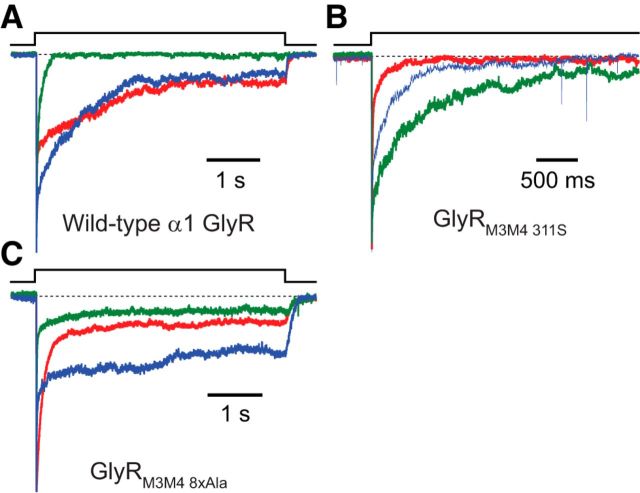
Figure 10.
Heterogeneity of α1 GlyR desensitization kinetics. A, Desensitization time courses recorded from three different patches of membrane containing the wild-type α1 GlyR. The traces in blue and green required two exponential components to achieve a good fit. However, the slower time constant of the exponential decay fitted to the trace in blue was an order of magnitude slower than that required to fit the time course in green. The time course in red required four exponential components to achieve a good fit. The differences between the displayed traces are indicative of the typical cell-to-cell variation observed with these receptors. In all cases, a fast-decaying component (4.92 ± 1.08 ms; Table 4) that would probably be missed in whole-cell recordings (even if a rapid, θ-tube-type perfusion of ligand were used) is present. B, Desensitization time courses recorded from three different patches of membrane containing the GlyRM3M4 311S construct. The trace in red required two exponential components to achieve a good fit, and the traces in green and blue required three. C, Desensitization time courses recorded from three different patches of membrane containing the GlyRM3M4 8xAla construct. The traces in green and red required three exponential components to achieve a good fit, whereas the trace in blue required four. For all three panels, the concentration of Gly during the ligand pulses was 10 mm, and the membrane potential was held constant at −80 mV. All recordings were performed using the outside-out configuration. In all panels, a dashed line indicates the current baseline. To allow for an easier visual comparison of the time courses across patches, all current traces were normalized to their peak values.

