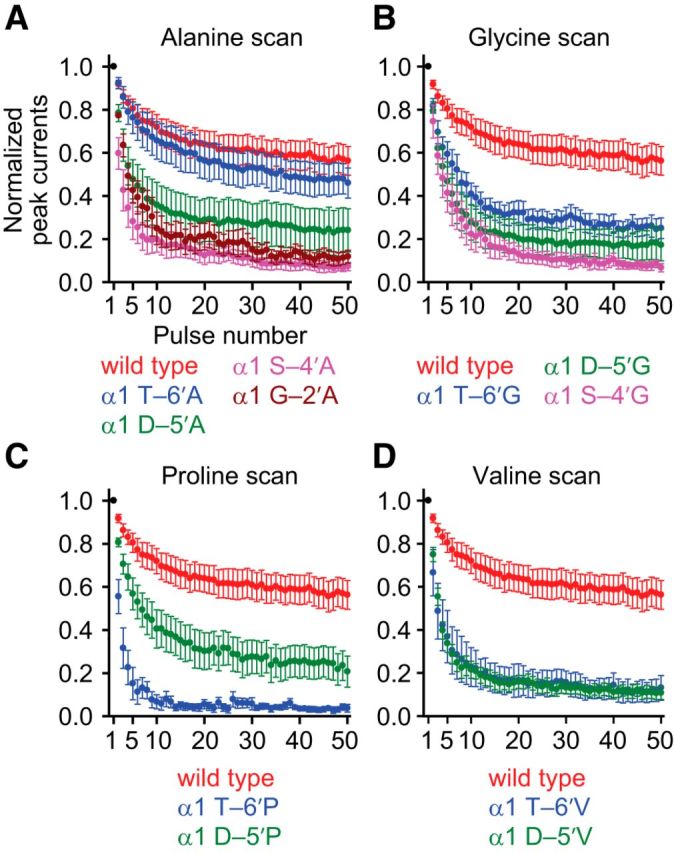
Figure 5.

Effects of M1–M2 linker mutations on the response to repetitive stimulation of the muscle AChR. Alanine (A), glycine (B), proline (C), and valine (D) scans were performed on the M1–M2 linker of the AChR α1 subunit, as for Figures 2–4. The concentration of ACh during the 1 ms ligand pulses was 1 mm, and the membrane potential was held constant at −80 mV. All recordings were performed using the outside-out configuration. Axis labels are the same for all four panels. Data points are the average values (normalized to the peak-current response to the first pulse of ACh, in black) obtained from several patches (between 4 and 14). Error bars indicate the corresponding SE. For all four panels, the train responses exhibited peak-response depression consistent with the kinetics shown in Figures 2–4. Interestingly, some M1–M2 linker mutations have a large effect on the response to repetitive stimulation despite only having a relatively small effect on deactivation and desensitization.
