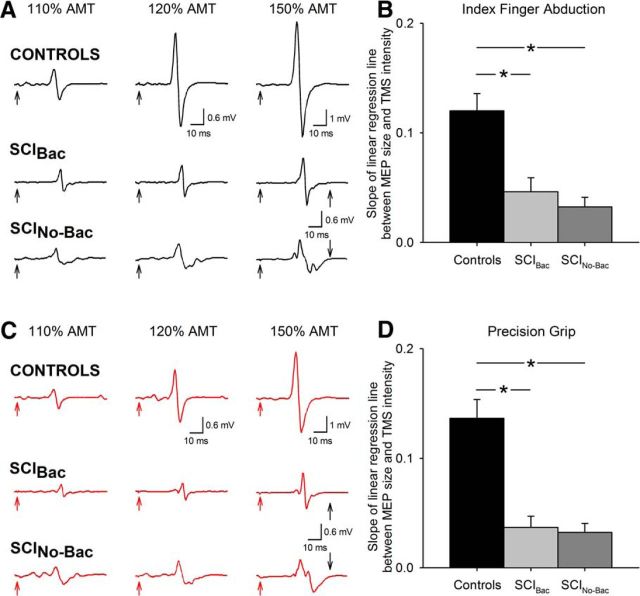
Figure 4.
Effect of increasing stimulus intensity on MEP size. MEPs tested in the FDI muscle during index finger abduction (A, black traces) and precision grip (C, red traces) in a representative control subject (top traces) and in SCIBac (middle traces) and SCINo-Bac (bottom traces). Traces show the average 20 MEPs on each condition tested at increasing TMS intensities. The time of stimulation is indicated by black and red arrows at the beginning of each trace. Note the pronounced increase in MEP size with increasing TMS intensities in the control subject, but to a lesser extent in patients. Group data are shown in separate graphs for index finger abduction (B) and precision grip (D) (controls, n = 15; SCIBac, n = 10; SCINo-Bac, n = 11). The abscissa shows all TMS intensities tested (110%, 120%, and 150%). The ordinate shows the slope of the linear regression line between MEP size and TMS intensity. Note that the MEP slope was larger in control subjects compared with SCIBac and SCINo-Bac in both tasks. Error bars indicate SE. *p < 0.05.

