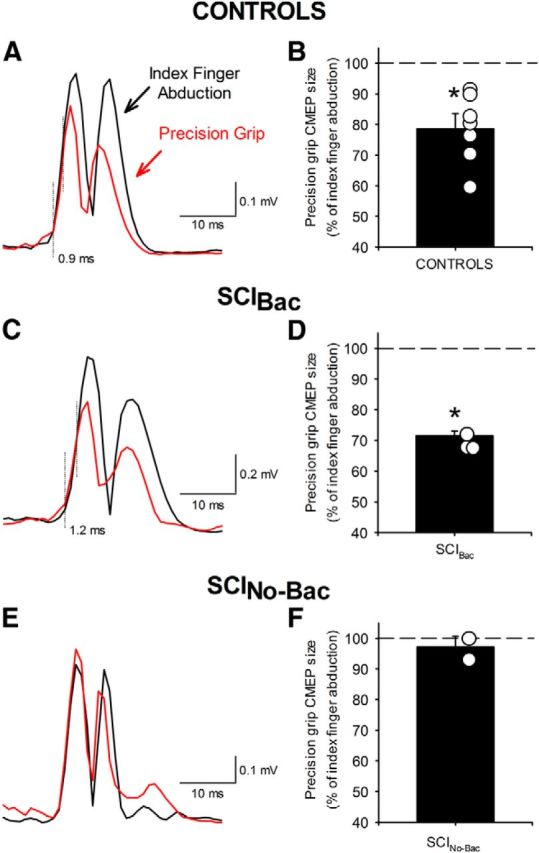
Figure 5.

MEPs elicited by cervicomedullary stimulation. Raw EMG data in three representative subjects (A, C, E) showing CMEPs recorded from the FDI muscle during index finger abduction (black traces) and precision grip (red traces). Fifteen rectified traces were averaged in each set. The dotted vertical lines indicate the approximate time of CMEP onset and when CMEP responses diverge. In the graphs, the abscissa shows the groups tested (B, controls, n = 7; D, SCIBac, n = 3; F, SCINo-Bac, n = 2) and the ordinate shows the size of CMEPs during precision grip as a percentage of the CMEPs tested during index finger abduction. The horizontal dashed line represents the size of the CMEPs during index finger abduction. Data from individual subjects in each group are shown in open circles. Note that the size of CMEPs decreased during precision grip compared with index finger abduction in controls and in SCIBac, but remained unchanged in SCINo-Bac. Error bars indicate SE. *p < 0.05.
