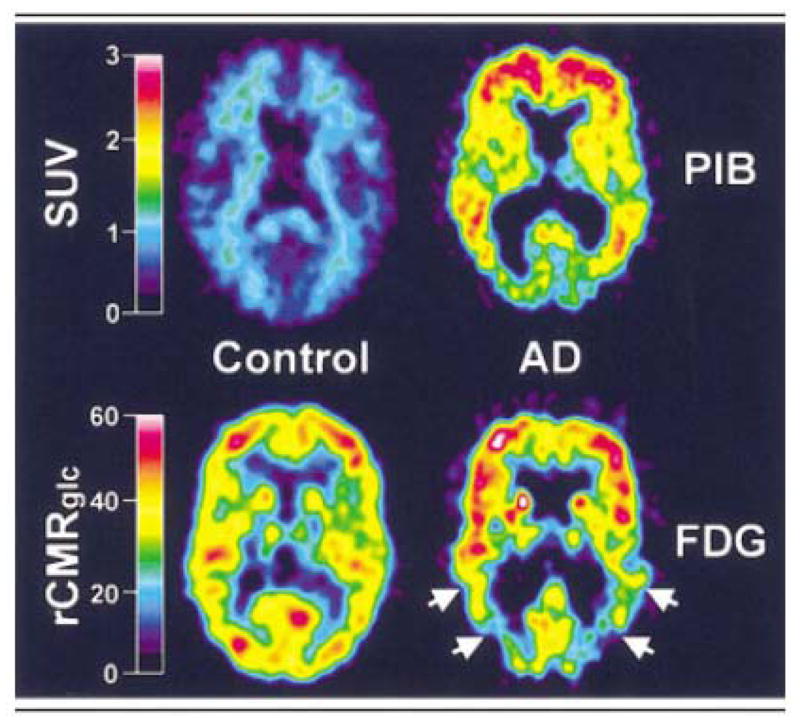
Figure 7.

A normal control (left panels) and Alzheimer patient (right panels) are compared with PIB imaging (top panels) and FDG imaging parametric maps (bottom panels). There is marked retention of PIB in the brain of the Alzheimer patient compared to the control. The changes on the FDG image, while still apparent, are much less striking (taken from [1]).
