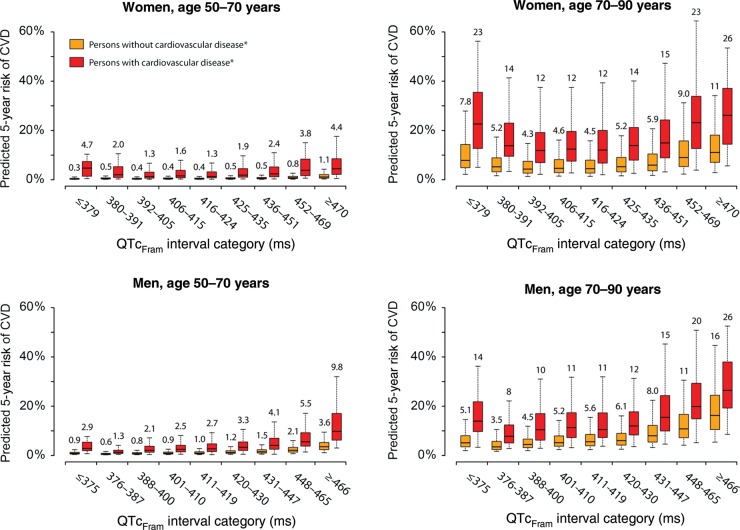
Figure 2.
Predicted 5-year risk of CVD based on subgroups. Both models for CVD and the competing models of non-CVD were independently performed for women and men in age groups 50–70 and 70–90 years, and contained the following covariates: age as a linear parameter, myocardial infarction, heart failure, valvular heart disease, a modified Charlson comorbidity index (0 points, 1 point, or ≥2 points), treatment with ACE-inhibitors or ARBs, beta-blockers or calcium antagonists prior to inclusion, treatment with QTc-prolonging medications or digoxin on the day of ECG recording, and left ventricular hypertrophy on the index ECG. Boxes denote the median risks (horizontal line) and interquartile ranges (lower and upper border) whereas whiskers denote the 5th and 95th percentiles. Numbers above the whiskers denote the median risk for the respective subgroup. Heart rate-correction was based on the Framingham formula (QTcFram).

