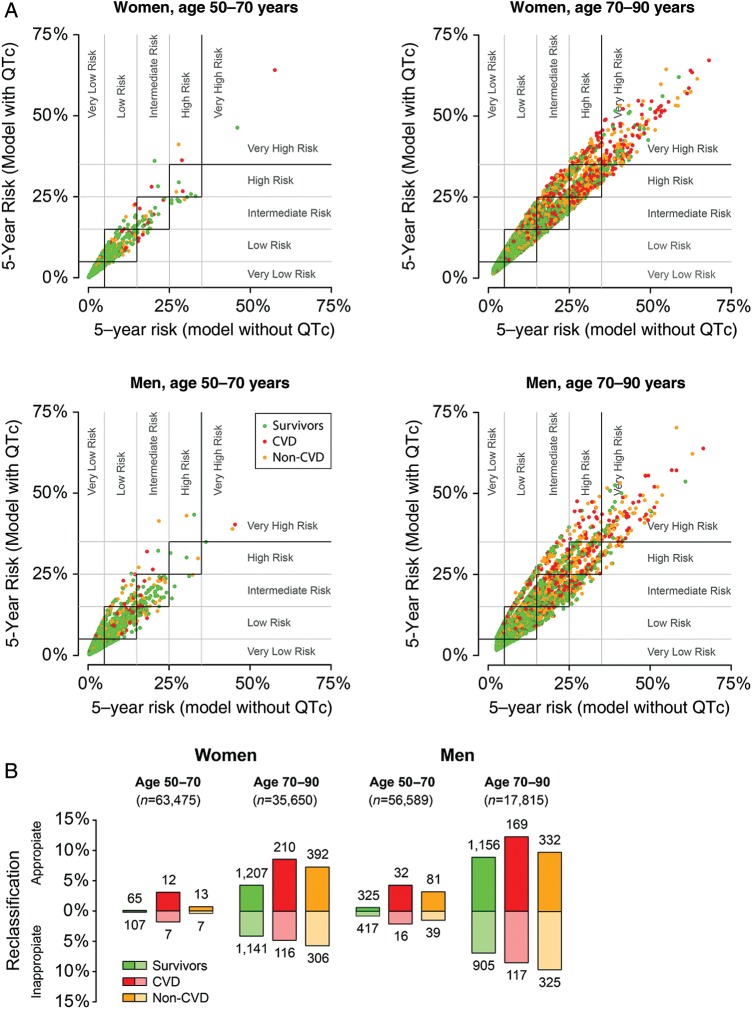
Figure 4.
(A) Reclassification within various 5-year risk categories based on predictions with and without QTcFram interval. The predictive models are described in Figure 2. Very low risk was defined as ≤5% risk of dying within 5 years, low risk was >5 to ≤15%, intermediate risk was >15 to ≤25%, high risk was >25% to ≤35%, and very high risk was defined as >35% risk of dying within 5 years (indicated by grey lines). Red and orange dots (CVD and non-CVD, respectively) above and green dots (survivors) below the squares with the black borders denote appropriate reclassifications whereas red and orange dots below and green dots above denote inappropriate reclassifications. Dots within the black-bordered squares denote individuals who were not reclassified. (B) Summary of reclassifications by subgroups. Numbers above or below columns denote the absolute number of appropriate and inappropriate reclassifications, respectively.

