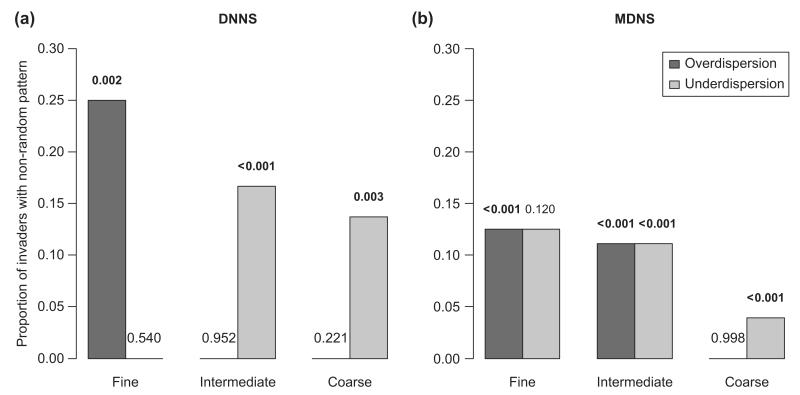
Figure 2.
Proportion of invaders for which phylogenetic distance of the invader to the native community (after partialling out the effect of species richness) deviated from random patterns generated through randomizations. Significantly greater distances than expected by chance indicate overdispersion, whereas smaller distances indicate underdispersion. P-values on top of the bars are obtained by combining the p-values of randomization tests for each single invader through a Fisher’s test. Bold type indicates overall significant deviations from random expectations (i.e. across invaders). In each panel sampling resolutions from left to right are 4 m2, 64 m2 and ca 35 km2.

