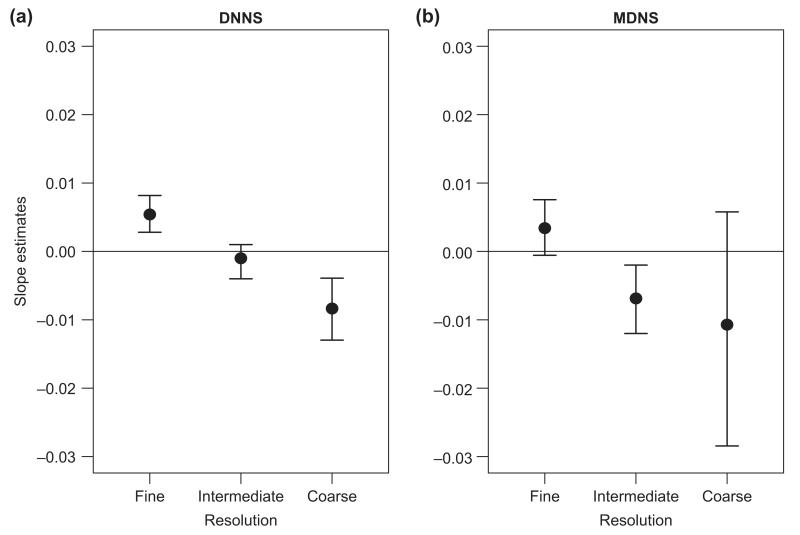
Figure 3.
Results of MCMC mixed effects models for the probability of community invasion as a function of the phylogenetic distance of the invader to the community (after partialling out the effect of richness). Plots depict the mean posterior distributions for the slope parameter (with 95% credible intervals plotted as bars) for the effect of DNNSresid and MDNSresid, at fine, intermediate and coarse spatial resolutions (i.e. 4 m2, 64 m2 and ca 35 km2).

