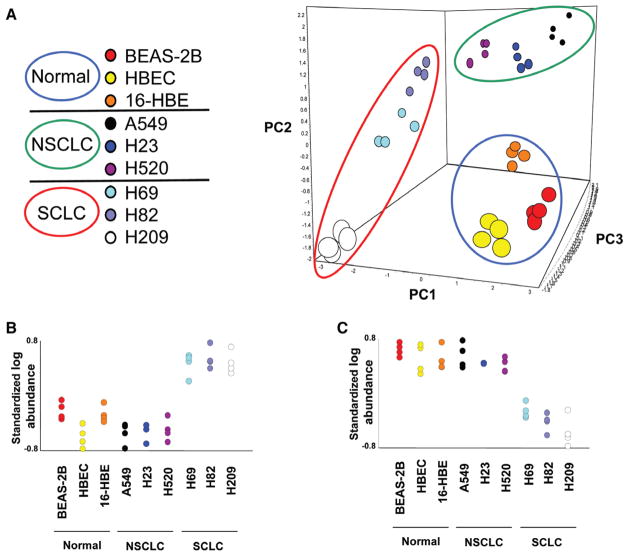
FIGURE 2.
DIGE results. A, PCA of the DIGE global data set. The axes correspond to the first three principal components. The apparent groups yielded by PCA are enclosed in circles: blue circle for immortalized normal bronchial epithelial cell lines (normal), green circle for NSCLC cell lines, and red circle for SCLC cell lines. The four replicates from each of the nine cell lines clustered very closely, as did samples within each histological subgroup. B, C, Quantitative analysis of protein expression in the nine cell lines analyzed by DIGE. Representative graphs of protein features significantly overexpressed (B) and underexpressed (C) in SCLC compared with immortalized normal bronchial epithelial and NSCLC cell lines (p < 10−3). The Y axis represents the standardized log protein abundance generated by the DeCyder analysis. DIGE, difference gel electrophoresis; NSCLC, non small-cell lung cancer; SCLC, small-cell lung cancer; PC, principle component; PCA, principal component analysis.

