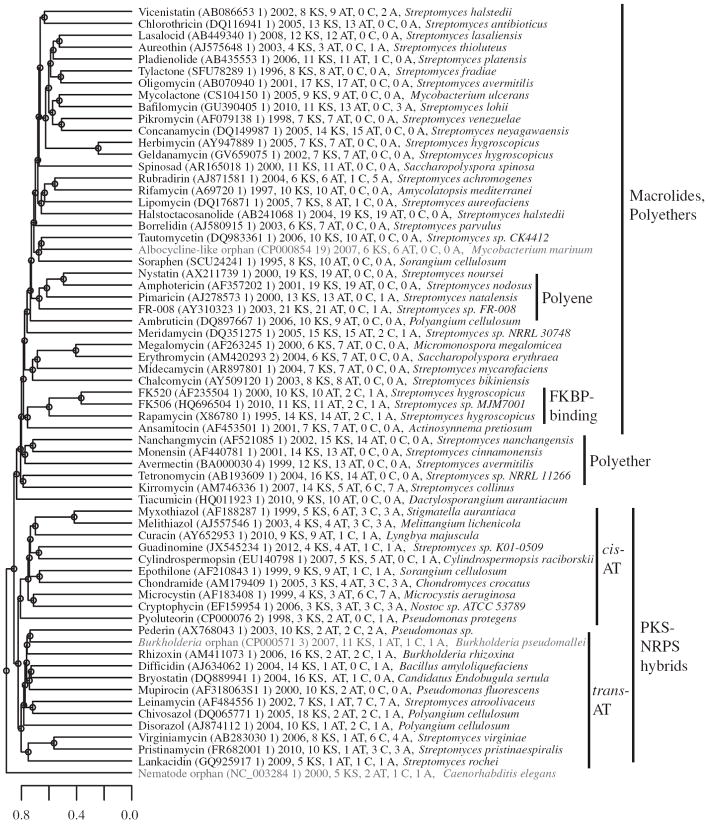
Figure 2.
Sequence similarity relationships among PKSs involved in the biosynthesis of known polyketide natural products. The amino-acid sequences of 62 representative assembly-line PKSs and PKS–NRPSs, plus the three orphan PKSs highlighted in this report, were compared in a pairwise manner using a gene-cluster similarity score. Scale bar displays the distance between gene clusters (between 0 and 1). The label for each PKS lists the Genbank ID and cluster number, date the sequence was deposited in NCBI, number of KS, AT, C and A domains, and sequence origin as listed in NCBI. The three orphans highlighted in the text are displayed in red. A full color version of this figure is available at The Journal of Antibiotics journal online.

