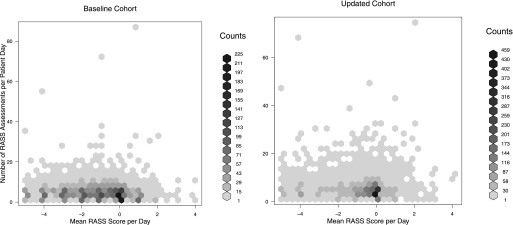
Figure 1.

Hex plot of mean number of Richmond Agitation Sedation Scale (RASS) assessments per day versus mean RASS score per day, in baseline versus updated, sedation-reducing cohort. The darker hexes denote more observations. The updated cohort features a greater number of RASS assessments as well as a higher (less sedated) mean RASS score (P < 0.01 for both). Note: Both the y-axes scales and the number of observations per hex shade are different in the baseline and updated cohort figures.
