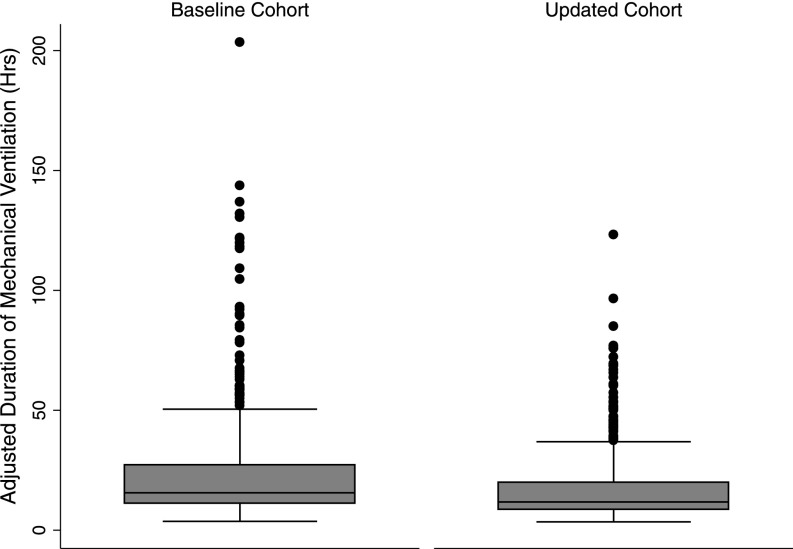
Figure 2.
Box plot of the adjusted duration of mechanical ventilation (hours) adjusted for SAPS, age, weight, and male sex in the baseline versus sedation-reducing protocol cohorts. The horizontal line at the center of the box denotes the median. The upper and lower boundaries signify the 75th and 25th percentiles, respectively. Outlying values are denoted with the box whiskers and dots. The updated cohort features a 17.6% reduction in the median duration of mechanical ventilation (95% confidence interval, 0.6–31.7%; P = 0.04).

