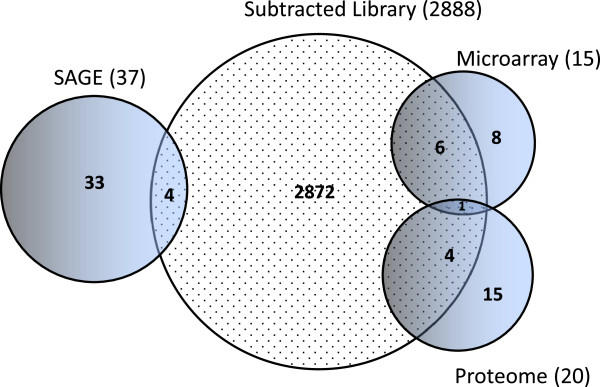
Figure 2.

Overlaps between the differentially expressed transcript datasets. A total of 2,888, 37, 20, and 15 transcripts make up the datasets from the subtracted library, SAGE, Rachinsky et al.[3] proteome and the microarray experiments. The numbers in the intersecting regions of the circles represent the number of transcripts that are common between the represented datasets.
