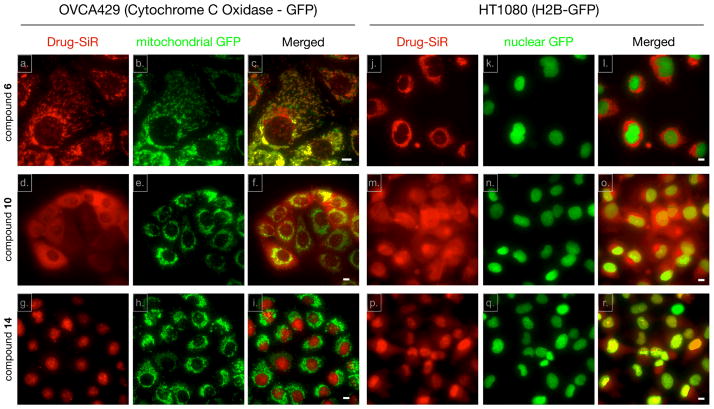
Fig. 2.
Live cell staining pattern of the three different companion imaging drugs in green fluorescence protein (GFP) cell lines. Both OVCA429 (expressing Cytochrome C Oxidase fused to GFP; a–c, d–f and g–i) and HT1080 (expressing H2B fused to GFP; j–l, m–o and p–r) cells were treated with 10 μM 6 (a–c and j–l), 10 (d–f and m–o) and 14 (g–I and p–r) for 30 minutes. After washing with growth media three times for 3 minutes each, live cell images were acquired using a DeltaVision fluorescence microscope equipped with a 40X objective. Scale bar: 10μm.

