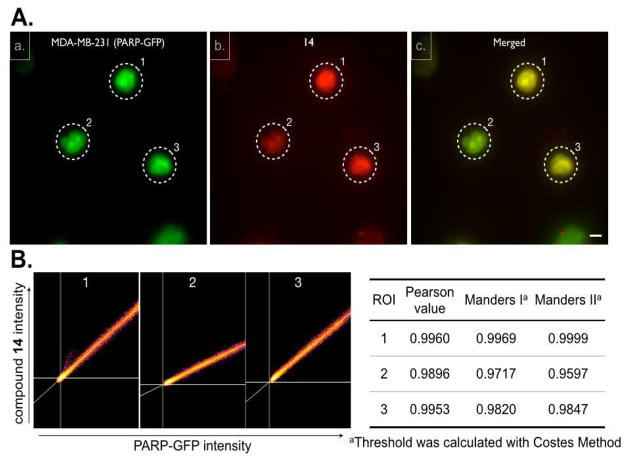
Fig. 3.
Colocalization of 14 with PARP1. A) Live cell imaging of MDA-MB-231 cells (expressing PARP1 fused to GFP) with 10 μM 14. a) PARP1-GFP cellular localization, b) 14, c) merged image showing colocalization between PARP1-GFP and 14. Scale bar: 10 μm. B) Colocalization scatter plot of representative cell (dotted circle) and table of Pearson and Manders correlation coefficients.

