
Fig. 3.
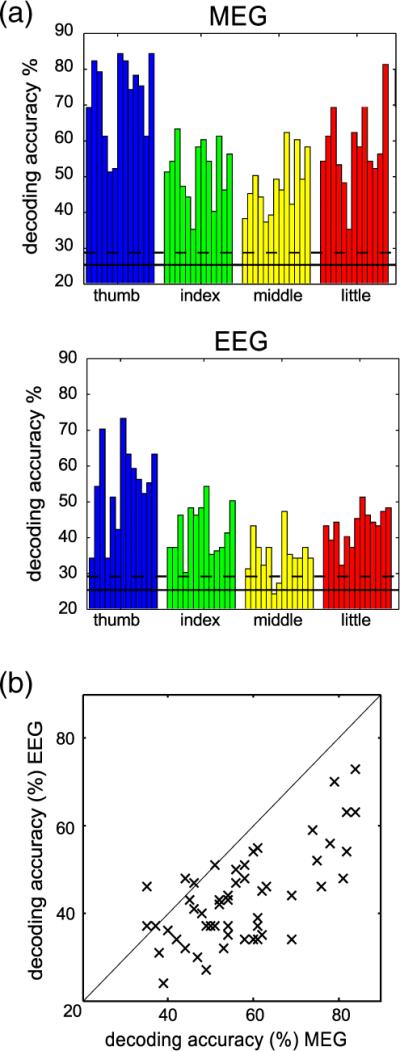
Classification performance. (a) Decoding accuracies of the one-vs-all support vector machine obtained with MEG (top) and EEG (bottom) data. Each bar represents the decoding accuracy of one combination of subject and finger (thumb, index, middle, and little finger). The horizontal solid line depicts the empirically estimated guessing level and the dashed line the upper 95% confidence interval for guessing. From MEG data every finger can be decoded reliably in every subject (average 57% correct, range 40% to 70%). However, with EEG data average decoding accuracy is lower and for some subjects some fingers do not exceed the confidence interval for guessing (average 43% correct, range 32% to 54%). (b) For comparison MEG (abscissa) and EEG (ordinate) decoding accuracies are plotted against each other. Each data point represents the DA for one combination of finger and subject. The diagonal line represents the line of equal accuracy. Nearly all points fall below that line, clearly indicating that MEG allows for more reliable single trial finger decoding.