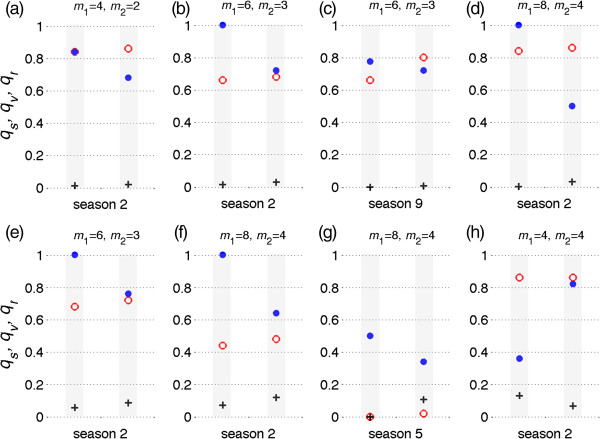
Figure 8.
Possible vaccine distributions to achieve the minimum number of infections in some seasons. Vaccine efficacy in prevention of infection is 80%, and m1 and m2 represent the durations of immunity induced by natural infection and vaccination, respectively, in the absence of re-exposure or vaccination following priming. For simulated seasons, two columns include red circles, blue dots, and plus signs representing optimal scenarios for vaccine distribution to susceptible, previously vaccinated, and previously recovered classes of individuals, respectively. The total fraction of the population vaccinated is 10% (a,b,c,d) and 20% (e,f,g,h). Other parameter values are given in Table 1.

