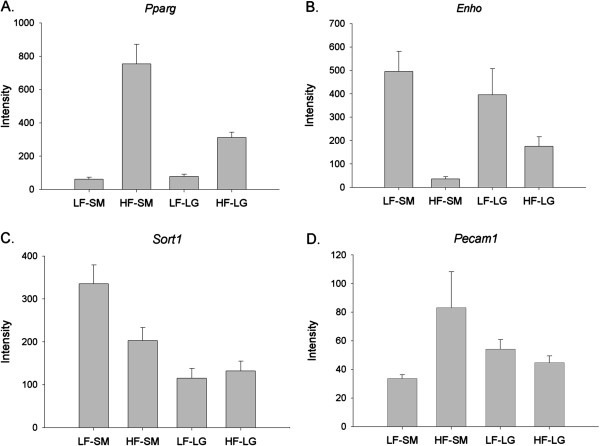
Figure 2.
Least square mean intensity values for genes within or near previously identified QTLs that exhibited a diet by strain interaction. (A) Peroxisome proliferator-activated receptor gamma (Pparg); (B) Energy homeostasis (Enho); (C) Sortilin (Sort1); (D) Platelet/endothelial cell adhesion molecule 1 (Pecam1). Abbrev: LF-SM: Low-fat SM/J; HF-SM: High-fat SM/J; LF-LG: Low-fat LG/J; HF-LG: High-fat LG/J. Graphs based on LS mean of raw intensity data. Error bars represent standard error of the mean.

