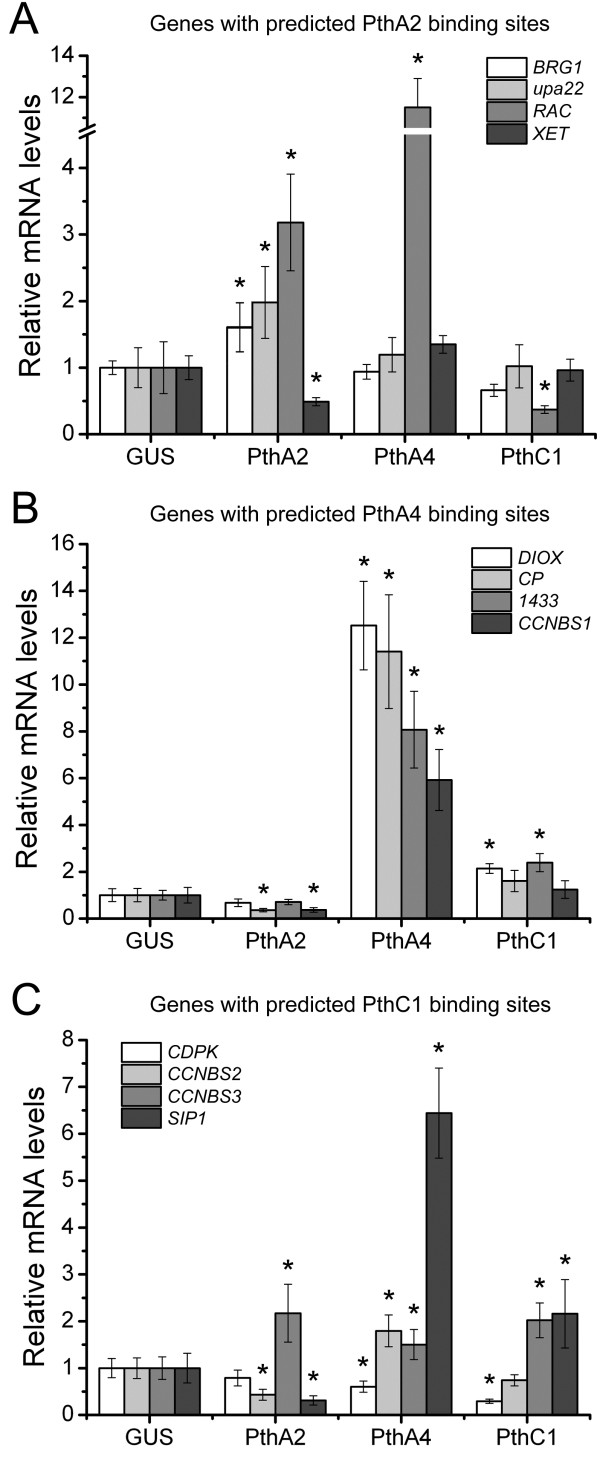
Figure 3.
Gene expression levels of predicted targets of PthA2, PthA4 and PthC1 in epicotyls transfected with the corresponding TAL effector. (A) Quantitative RT-PCR (qPCR) of four sweet orange genes with best-scoring effector-binding elements (EBEs) predicted for PthA2 in their promoters. (B) qPCR of four sweet orange genes with best-scoring EBEs predicted for PthA4 in their promoters. Predicted PthA4 target genes are significantly and predominantly up-regulated by PthA4 expression. (C) qPCR of four sweet orange genes with best-scoring EBEs predicted for PthC1 of XaC in their promoters. The expression levels are the mean of three independent biological replicates. The error bars denote standard deviations whereas asterisks indicate statistically significant differences (p < 0.05) in the mRNA levels in epicotyls expressing the TAL effectors relative to GUS.

