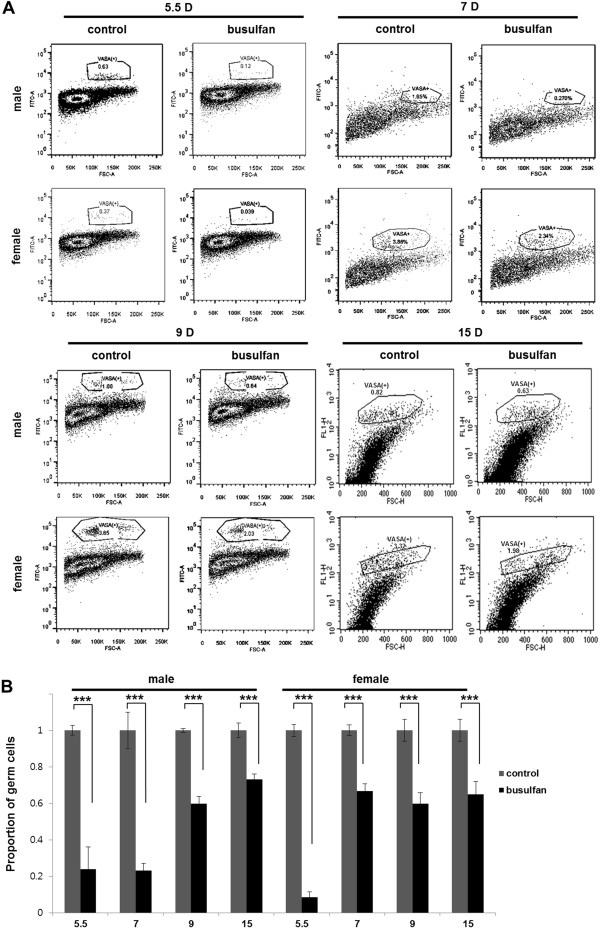
Figure 4.
Proportion of primordial germ cells (PGCs) in the embryonic gonads after busulfan treatment at stage X. (A) Representative flow cytometry dot plots of day 5.5, day 7, day 9 and day 15 embryonic gonadal cells labeled with anti-VASA. (B) Proportion of PGCs in the embryonic gonads of the busulfan-treated group. Data were normalized to the proportion of PGCs in the control. Bars indicate standard error of the mean of triplicate analyses. ***P <0.001, significant difference compared with control.

