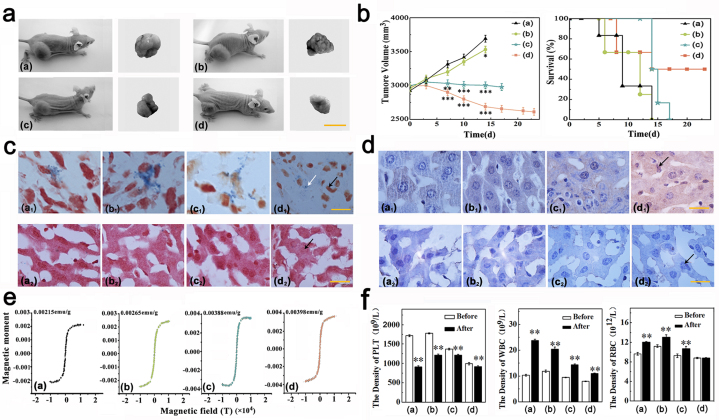
Figure 3. Measured efficacy and toxicities data in vivo.
(a). Photos for tumor-bearing mice treated by the four kinds of OA-MNPs: (a) OA-MNPs-a, (b) OA-MNPs-b, (c) OA-MNPs-c, and (d) OA-MNPs-d. The yellow bar stands for 1 cm. (b). Tumor volume (left) and survival rate (right) of the nude mice as a function of time (day) upon the treatment by (a) OA-MNPs-a, (b) OA-MNPs-b, (c) OA-MNPs-c, and (d) OA-MNPs-d. The animal test is plotted with the significance p < 0.05 labeled by symbol *, 0.001 < p < 0.01 labeled by symbol **, and p < 0.001 labeled by symbol ***. The standard deviation for a and b is n = 6. (c). Prussian blue staining of tumor tissue upon the treatment by (a) OA-MNPs-a, (b) OA-MNPs-b, (c) OA-MNPs-c, and (d) OA-MNPs-d. The yellow bar stands for 15 μm. The white arrow means that the cells are treated by the OA-MNPs, and the black arrows mean that the tumor tissue and liver tissue. (d). Anti-ssDNA analysis of tumor tissue upon the treatment by (a) OA-MNPs-a, (b) OA-MNPs-b, (c) OA-MNPs-c, and (d) OA-MNPs-d. The yellow bar stands for 15 μm. The black arrows mean that the tumor tissue and liver tissue. (e). Magnetic hysteresis loops of tumor tissues upon the treatment by (a) OA-MNPs-a, (b) OA-MNPs-b, (c) OA-MNPs-c, and (d) OA-MNPs-d. (f). Serological and toxicology test of nude mice, including the density of platelet (left), the density of white blood cell (middle), and the density of red blood cell (right), upon the treatment by (a) OA-MNPs-a, (b) OA-MNPs-b, (c) OA-MNPs-c, and (d) OA-MNPs-d. The serological and toxicology test are plotted with the significance p < 0.05 labeled by symbol *, 0.001 < p < 0.01 labeled by symbol **. The bars stand for the standard deviations (n = 3).

