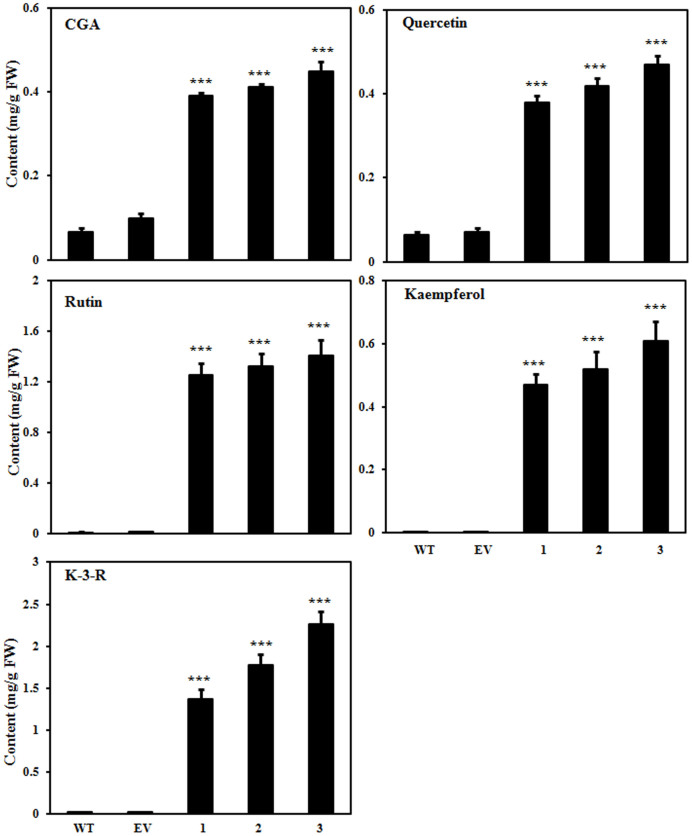
Figure 4. Qualitative and quantitative estimation of the flavonols and CGA content in plants.
Compounds were quantified by separating methanolic as well as acid hydrolyzed methanolic extracts from the young leaves of WT, EV and transgenic lines using HPLC. A typical HPLC chromatogram is given in Supplementary Fig. S2 & S5. The graph shows values ± SD of three leaves from each of the independent transgenic line. Data are expressed as means ± SE of at least 3 independent experiments, each experiment consisting of 3 technical replicates. *** indicate values that differ significantly from WT at P < 0.001, according to Student's paired t-test.

