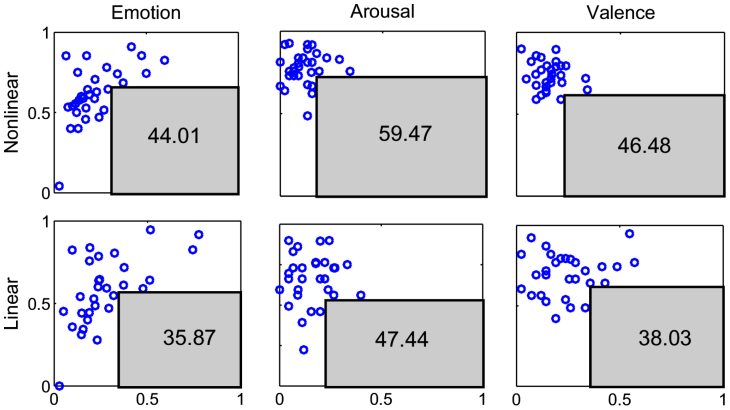
Figure 6. Complementary Specificity-Sensitivity Plots (CSSPs) for the three emotion classification cases.
In all panels, each blue circle represents a subject of the studied population, the x-axis represents the quantity 1-specificity (i.e. false positive rate), and the y-axis represents the sensitivity (i.e. true positive rate). The gray rectangles define the maximum area under the points. Numbers inside the rectangles indicate the maximum area under the points expressed as percentage of the unit panel area. On top, from left to right, the three panels represent the CSSPs obtained using features from the point process NARI model and considering the arousal, valence, and self-reported emotion classification cases. Likewise, on the bottom, the three panels represent the CSSPs obtained using features from a point process linear model.

