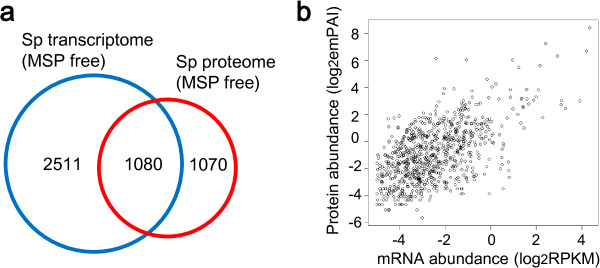
Figure 3.

Comparison of sperm transcriptome and proteome. (a) Venn diagram showing the overlap between the sperm transcriptome and the sperm proteome (MSPs and predicted proteins were excluded). The number of genes/proteins in each part is indicated. (b) Plot showing sperm mRNA and protein abundances are well correlated.
