Figure 7.

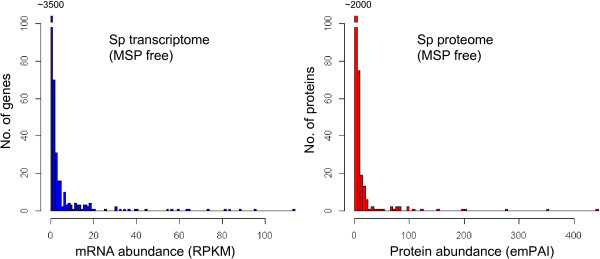
Sperm transcriptome and proteome show skewed abundance. Histograms showing the distributions of sperm gene (left panel) and protein (right panel) abundances.

Sperm transcriptome and proteome show skewed abundance. Histograms showing the distributions of sperm gene (left panel) and protein (right panel) abundances.