Figure 1.
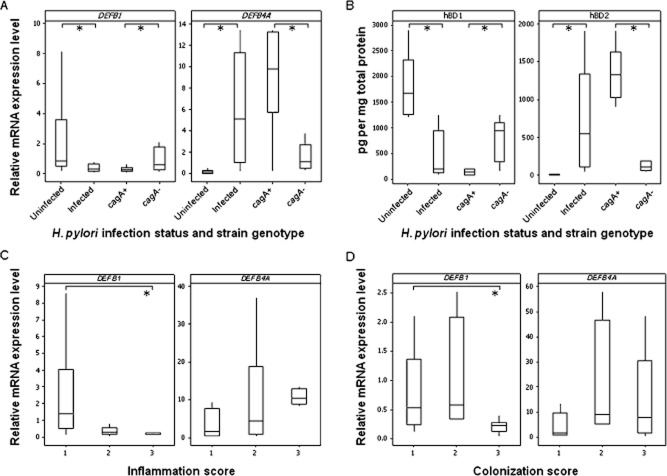
Analysis of hβD1 and hβD2 expression during H. pylori infection in vivo. Levels of DEFB1 and DEFB4A mRNA were measured in the gastric mucosa of 23 uninfected and 31 H. pylori infected donors (A: *P = 0.005 and P = 0.001 respectively), and compared according to cagA genotype status of the colonizing strain (A: *P = 0.028 and P = 0.006 respectively). hβD1 and hβD2 protein concentrations in gastric biopsies from five uninfected and 10 H. pylori infected donors were measured (B: *P = 0.001 and P = 0.001), and concentrations in five cagA+ and five cagA− biopsies were also compared (B: *P = 0.016 and P = 0.004). Expression levels were also stratified based on histological inflammation scores graded from gastric biopsy tissue sections as mild (score of 1, n = 6), moderate (score of 2, n = 20) or substantial (score of 3, n = 5) (C: *P = 0.045). Data were also stratified according to bacterial density scores: mild (score of 1, n = 13), moderate (score of 2, n = 5) or substantial colonization (score of 3, n = 13) (D: *P = 0.001). RT-qPCR data were normalized against GAPDH and expressed relative to measurements from an uninfected tissue comparator. Protein concentrations were calculated per mg of total protein. Boxes represent the first and third quartiles with median values shown as a horizontal line within the box. Whiskers represent the lowest and highest observations within 1.5 times the first and third quartile.

