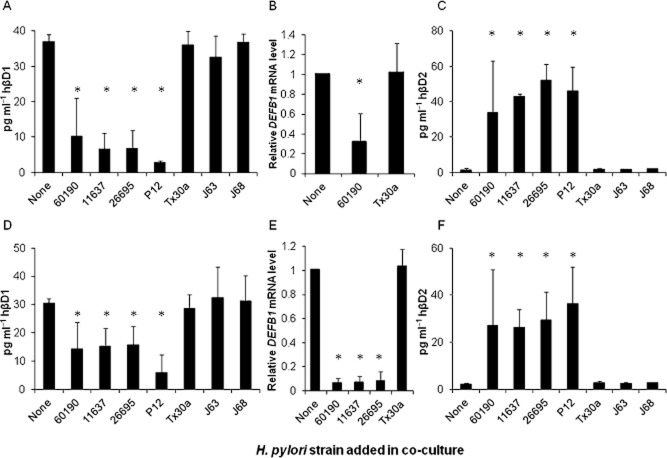
Figure 2.
Analysis of hβD1 expression during H. pylori infection in vitro. MKN7 (A–C) and AGS (D–F) cell lines were infected with H. pylori strains 60190, 11637, 26695, P12 (all cagA positive and expressing the s1/m1 form of vacA), and Tx30a, J63, J68 (cagPAI−, vacA s2/m2) for 24 h. hβD1 and hβD2 protein concentrations in culture supernatants were measured by ELISA (A, C, D and F). hβD1 mRNA expression was measured by RT-qPCR (B and E), and data presented as fold differences relative to that measured in uninfected cells. Bars depict mean expression levels from three independent experiments and error bars show standard deviations. The asterisk (*) indicates a significant difference in expression compared with uninfected cells (P < 0.01).

