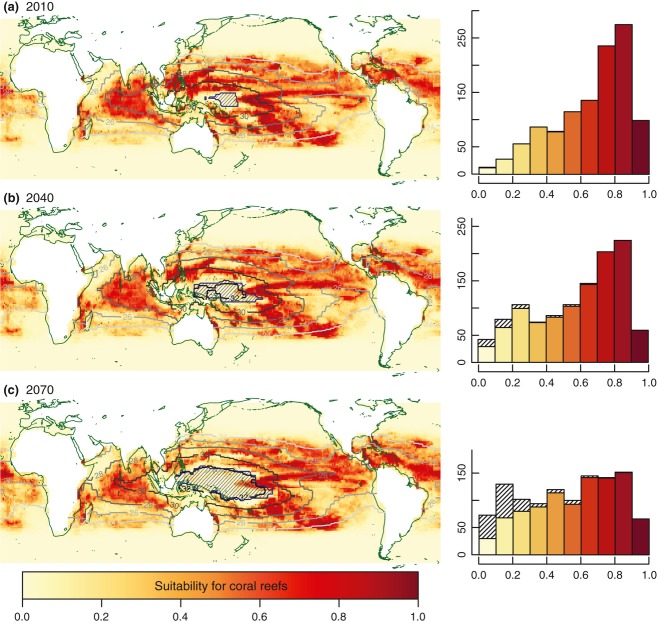
Figure 2.
Predicted changes in suitability for coral reef ecosystems under the A2 scenario for future change in sea surface temperature (SST) variables only; 2010 (a), 2040 (b) and 2070 (c). Histograms show predicted suitability values for the 1124 presence sites of the study grid (i.e., cells currently with reefs according to the ReefBase v2000 data). All environmental fields apart from SST variables were kept constant at their present values (used in model training). Areas where projections are less reliable (i.e., SST out of training range and MaxEnt clamping value >0.1; see Data S2) are indicated by the hatched pattern, in both maps and histograms. The figure shows BRTOPT model's results (see figure S3.1 in Data S3 for MaxEntOPT's projections).

