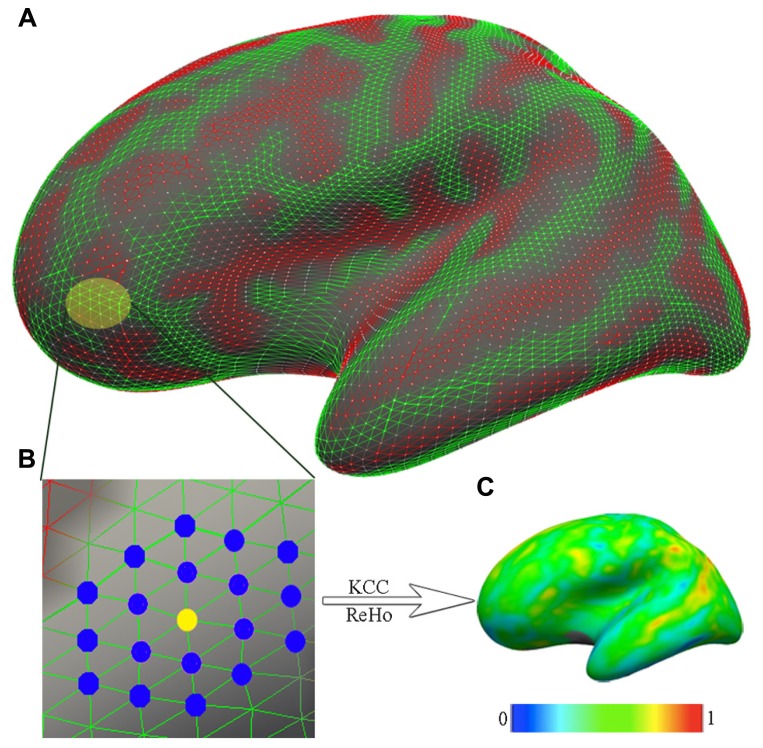
FIGURE 1.
The computation of functional homogeneity on the cortical surface. (A) The geometry of the cortical surface (e.g., here, the lateral cortical surface of the left hemisphere). (B) The preprocessed R-fMRI data are projected onto vertices of the cortical surface. For a given vertex (yellow node), which is indicated as the light yellow patch in (A) and magnified in (B), the nearest neighbors are colored blue. Based on R-fMRI time series from all 19 vertices, the Kendall’s coefficient of concordance (KCC) of the center vertex is calculated as the regional homogeneity (ReHo). (C) Such calculations are repeated for all vertices on the surface to produce individual vertex-wise KCC-ReHo surface maps. The color map indicates the intensities of the KCC values.

