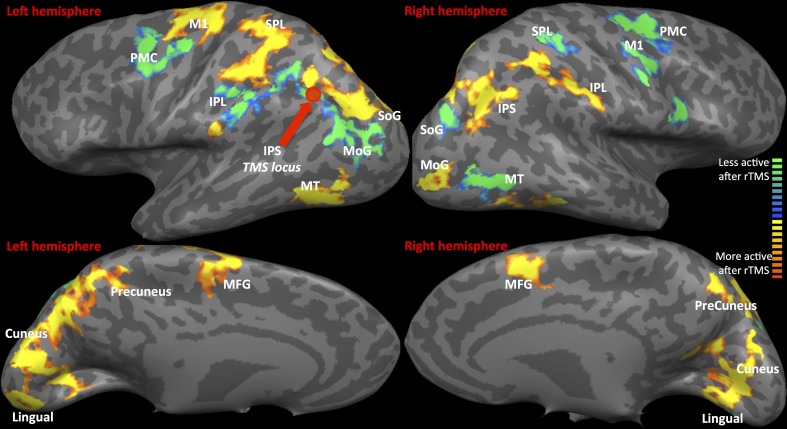
Figure 2.
fMRI-Regions of interest analysis (ROIs) identified from Multi-Subject Fixed Effects GLM analysis. FMRI Activation Maps displaying results of Multi-subject fixed effects GLM with comparisons between pooled runs (1, 2, and 3) of rTMS vs. sham. Locus of rTMS targeting is shown as filled purple circle over the left IPS. Red-to-yellow: activation following rTMS > sham; blue-to-green: activation following rTMS < sham. Abbreviations are expanded in Table 1.

